Pet Ownership Statistics You Should Know in 2026

If you live in the U.S., chances are you share your home with a pet. About 94 million households own a pet, most often a dog (51%) or a cat (37%)1. Pet ownership is strongest among younger Millennials, led by Gen X and Baby Boomers, while Gen Z is quickly catching up2.
To understand how these trends are shaping the nation, we have gathered the latest data from multiple trusted sources to show what pet ownership in the U.S. looks like in 2026.
Pet Ownership at a Glance
From dogs and cats to fish and small animals, the total number of pets in U.S. homes continues to rise.
- 94 million U.S. households own at least one pet, up from 82 million in 2023 - a steady rise in pet ownership over the past two years.
- Pet industry spending reached $152 billion in 2024
- Dogs are the most popular, followed by cats and freshwater fish
- Millennials make up the largest share of pet parents (30%), followed by Gen X (25%) and Baby Boomers (25%)3
- Since 2020, the number of insured pets has doubled, reaching 6.4 million in 20244
Pet Owner Statistics
Homeowners are more likely to have pets than renters. About 58% of homeowners own a dog and 36% own a cat, compared to 39% and 29% of renters5. It’s easier to have pets when you own your home, have more space, and have no fees or landlord rules to worry about.
Pet ownership is also higher in rural areas (71%) than in suburban (62%) or urban (53%) communities6. With more outdoor space and fewer housing limits, rural households tend to welcome more pets than city residents.
Most pet owners said they keep animals to avoid loneliness or help them cope with hard times. Studies show that women describe their pets as companion animals that provide emotional support, while men often value their role in helping them stay active7.
Pet Ownership by Generation
Millennials lead the pack in 2026, making up 30% of pet owners, followed by Gen X and Baby Boomers at 25% each. Gen Z currently represents about 20% of all pet owners but is quickly catching up, with a 43.5% rise in ownership since 2023. Also, about 7 in 10 Gen Z pet owners are likely to have multiple pets at home.

Wealth & Pets
Most dog owners fall in the $50,000–$74,999 income range, while most cat owners earn $30,000 or less8. Families with higher incomes tend to spend more on preventive care, premium food, and pet insurance, while lower-income households often limit costs to essentials.
There’s even a correlation between your income and what types of pets you like. Ultra-high-net-worth (UHNW) individuals tend to like horses and dogs more than cats, fish, and birds, according to research firm Wealth-X9:

Nearly 40% of pet owners admit they’ve had to skip care they knew their pet needed. At the same time, more than 90% would make major sacrifices (like spending less on themselves or taking on debt) to keep their pets safe and healthy10.
The amount spent on pets varies by state as well. On average, pet owners spend about $2,500 per year on food, veterinary care, and other essentials. Dog ownership costs the most in Alaska and Hawaii (about $3,500 a year) and the least in Alabama and Arkansas (around $2,200)11.
The Most Popular Pets
The dog remains the leading pet in America, but cats are not far behind. According to the 2025 APPA survey12:
- Dogs: 68 million households
- Cats: 49 million households
- Freshwater fish: 10 million households
- Birds, reptiles, and small animals: 6 million each
- Horses and saltwater fish: 2 million each

Dog Ownership Statistics
Historically, dogs have been America’s favorite pets. But between 2018 and 2024, dog ownership dropped from 42% of U.S. households to 38%. Homes with only dogs went down from 30% to 26%, while more families started owning both dogs and cats.13
Among dog owners, only 8% had a puppy under one year old in 2024, down from 11% in 2018, and more than half of all dogs were seniors.
Dog Breed Statistics
In 2024, the French Bulldog held the top spot as America’s most popular dog for the second year in a row, according to the American Kennel Club (AKC).14 Known for being small, social, and easy to care for, Frenchies fit well in both apartments and houses.
The Labrador Retriever, once the nation’s longtime favorite, came in second but remains loved for its friendly nature and loyalty.
Here’s the full top five list:
- French Bulldog
- Labrador Retriever
- Golden Retriever
- German Shepherd Dog
- Poodle
Cat Ownership Statistics
Cat ownership has grown slightly in recent years. From 2018 to 2024, the percentage of U.S. households with cats increased from 23% to 24%. Homes with only cats also rose from 11% to 12%.15
More people are choosing cats because they cost less to care for and require fewer veterinary visits, which matters for lower-income families and seniors. They’re also easier to maintain and fit well in smaller homes and apartments.
Cat Breed Statistics
According to the Cat Fancier’s Association (CFA), here are the top 5 cat breeds in 2024:16
- Maine Coon Cat
- Ragdoll
- Persian
- Exotic
- Abyssinian
Maine Coons (known as the ‘’gentle giant’’) remain the most popular for being friendly and playful despite their impressive size, followed by the Ragdoll, which stands out for its soft, beautiful coat and calm, gentle nature.

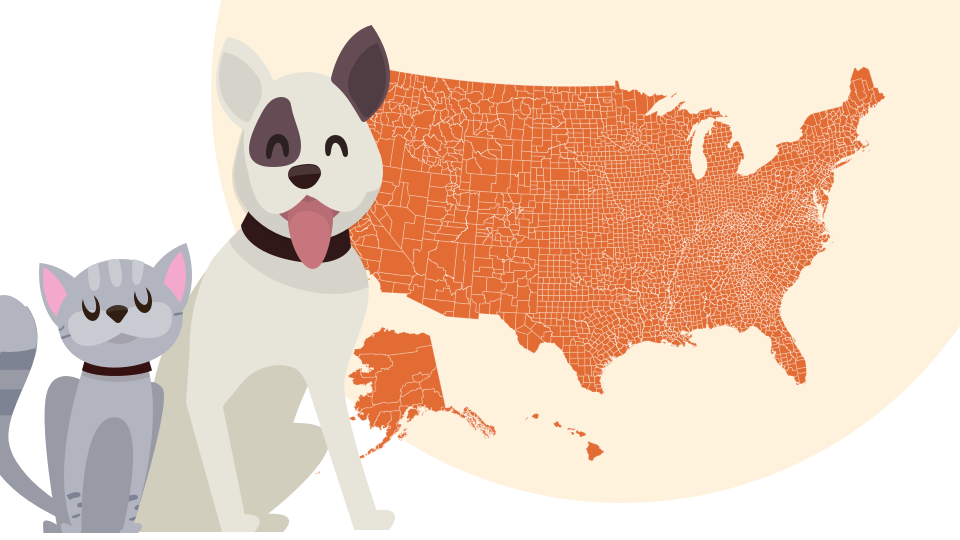
(Image Source: Spots.com)
Pet Ownership Statistics by States

(Image Source: Zippia)
Wyoming and West Virginia were the two states with the highest rates of pet ownership in 2018, according to a study by the AVMA. On the other hand, California and Rhode Island were two of the states with the lowest rates of pet ownership in the AVMA study. Pet ownership is generally lower in urban areas.
Meanwhile, the three states with the highest rates of dog ownership were Arkansas, Montana, and West Virginia. The states with the highest rates of cat ownership were Vermont, Maine, and Oklahoma.
Here is the full list:
State | % of Pet Owners | % of Dog Owners | % of Cat Owners |
|---|---|---|---|
Wyoming | 71.8 | 36 | 30 |
West Virginia | 70.7 | 49.6 | 37.7 |
Vermont | 70 | 28.3 | 44.6 |
Idaho | 69.9 | 33.3 | 34.4 |
Indiana | 69.2 | 49.4 | 37.5 |
Arkansas | 69 | 51.6 | 34.8 |
Mississippi | 65.5 | 51 | 29.1 |
Oklahoma | 65 | 47.7 | 38.4 |
Colorado | 64.7 | 47.2 | 27.1 |
Kentucky | 64.1 | 46.5 | 32.2 |
North Dakota | 63.7 | 44.3 | 24.8 |
Maine | 63.5 | 35.9 | 43.6 |
Missouri | 63.5 | 45.1 | 26.8 |
Kansas | 62.8 | 43.1 | 32.4 |
Washington | 62.7 | 42.8 | 30.5 |
Ohio | 62.4 | 37.9 | 30.7 |
Michigan | 62.4 | 41.9 | 31.2 |
South Carolina | 62 | 45.3 | 25.2 |
Montana | 61.9 | 51.9 | 22.8 |
Tennessee | 61.7 | 47 | 30.9 |
Pennsylvania | 60.6 | 38.9 | 29.9 |
New Mexico | 60.1 | 39.4 | 25.2 |
Alabama | 59.8 | 46.9 | 26.1 |
Iowa | 59.4 | 36.3 | 35.6 |
Oregon | 59.2 | 37.8 | 30 |
Wisconsin | 59 | 33.6 | 32.4 |
North Carolina | 58.6 | 41.3 | 26.5 |
Utah | 58.5 | 36.2 | 24.7 |
Texas | 58.2 | 43.4 | 20.5 |
Arizona | 58 | 43 | 26.4 |
Delaware | 57.9 | 42.2 | 24.1 |
Florida | 56 | 39.8 | 24.2 |
Virginia | 55.5 | 35.6 | 23.9 |
Louisiana | 54.4 | 38.3 | 19 |
Minnesota | 54 | 35.5 | 26.5 |
Nevada | 53.3 | 36.8 | 23.1 |
New Hampshire | 51.8 | 23.7 | 36.4 |
Nebraska | 51.3 | 47.1 | 30.9 |
Georgia | 51.1 | 36.7 | 20.4 |
Connecticut | 49.9 | 24 | 26.7 |
New York | 49.7 | 27 | 21.1 |
Massachusetts | 49.4 | 28.9 | 23.5 |
Illinois | 48.6 | 32.4 | 21 |
Maryland | 48.6 | 30.2 | 18.6 |
New Jersey | 47.4 | 29.1 | 18.9 |
South Dakota | 46.4 | 32.1 | 26.6 |
Rhode Island | 45.4 | 25.8 | 16.7 |
California | 40.1 | 40 | 22.9 |
When it comes to cities with the most pets, Los Angeles leads with about 2.6 million cats and dogs, followed by New York City with around 1.1 million. Tampa, Florida, was also named the most pet-friendly city in America by WalletHub in 2020 for its many parks and pet-friendly spaces17.
Pet Ownership Trends Over the Last 50 Years
Pet ownership in the U.S. has come a long way since the late 1980s. In 1988, only 56% of households had a pet18. In recent years, that number has climbed to over 70%, with roughly 94 million U.S. households owning pets in 2024 - proof of long-term pet ownership growth.

The first big wave of pet owners came from the Baby Boomer generation, who helped spark the humanization of pets trend. Decades ago, pets mostly lived outdoors. Today, they sleep in beds, have birthday parties, and even go to daycare.
As Boomers age, many are replacing grown children with pets. There are now more households with pets than with children, according to the National Association of Realtors19.

Better nutrition and healthcare are the reasons why diseases common amongst pets 40 years ago have all disappeared. Pets now suffer from conditions resulting from old age20.
Reasons Why People Own Pets
People own pets for many different reasons, but the most common one is companionship. Pets make people feel less lonely and provide comfort during stressful or difficult times. According to research from the Animals & Society Institute21, most owners say they keep pets to avoid loneliness or to have emotional support at home.
Pets also help people stay active and social. Many owners reported that having a dog encourages daily walks and social interaction. For most, their pets give them a sense of purpose and routine, which supports both physical and mental health.
There are also differences by gender. Studies show that women are more likely to view pets as emotional companions, while men tend to value how pets encourage outdoor activity and exercise.
Cost of Pet Ownership
Owning a pet brings joy, but it also comes with ongoing costs. The American Veterinary Medical Association (AVMA) reports that U.S. households spent an average of $1,515 on their pets in 2024, not including adoption or purchase fees22.
- Dog owners spent the most - over $1,700 per year.
- Cat owners spent less, averaging under $1,350 per year.
Most of this spending goes toward food, vet visits, and supplies. Veterinary care made up about one-third of all pet expenses, but overall spending on vet care fell by 4% from 2023 to 2024.

Cost of Pet Ownership by State
Studies show that Seattle and San Francisco lead the country in pet spending, with expenditures about 30% above the national average23. New York City and Boston follow closely behind. On the other hand, cities like San Antonio, St. Louis, and Atlanta reported below-average costs.
Another study from ConsumerAffairs ranks Alaska as the most expensive state for dog owners, with annual costs averaging about $3,54024. Hawaii follows closely behind. At the other end of the list, Arkansas and Alabama are among the most affordable states, with average costs of $2,200 to $2,300 per year.
Rising Cost of Veterinarians
Vet costs vary based on where you live, what kind of pet you have, and the care your pet needs. According to the American Veterinary Medical Association (AVMA), the average cost of a vet visit in 2024 was about $214 for dogs and $138 for cats25.

These costs are typically higher for dogs due to more frequent visits and additional care needs. Prices can rise depending on your pet’s size, health, and whether extra tests or treatments are required. Emergency visits, surgeries, and diagnostic tests are usually the most expensive parts of veterinary care.
What affects vet prices:
- Clinic location and local cost of living
- Pet size, breed, and age
- Routine vs. emergency visit
- Added services like vaccines, diagnostics, or surgeries
Veterinary care remains one of the biggest costs for pet owners. That’s why many pet owners now turn to pet insurance to manage unexpected bills. You can compare plans through Pawlicy Advisor to find affordable options and reduce out-of-pocket costs for your pet’s care.
Recommended Reading: Best Pet Insurance Companies
Pet Ownership FAQs
What percentage of US households own at least one pet?
About 66% of U.S. households have one or more pets, according to the American Pet Products Association (2023-2024).
What are the US states with the most pet owners?
The AVMA estimates that Wyoming and West Virginia have the highest rates of pet ownership.
Which US city has the most pet owners?
There are estimated to be more than 2.6 million privately-owned cats and dogs in Los Angeles. For context, there are roughly 1.1 million pets in New York City.
What age group owns the most pets?
Millennials own the most pets in the United States, representing 30% of all pet owners. Generation X and Baby Boomers are tied for second place at 25% each.
What is the average age of a dog owner?
The median age of dog owners in the United States is 49 years old, according to Simmons Market Research (2016)26.
What country has no stray dogs?
The Netherlands reduced its stray dog population to nearly zero in 2019. They accomplished this through a nationwide collect, neuter, vaccinate, and return (CNVR) program, as well as through high taxes on any animal bought from stores. The latter encouraged more people to adopt from animal shelters.
Who owns the most dogs in the world?
The United States. It’s home to about 78 million, according to the World Population Review27.
What is the most popular dog breed?
The French Bulldog is currently the most popular dog breed in the United States, according to the American Kennel Club's 2025 rankings. Labrador Retrievers, which held the #1 spot for 31 consecutive years, now rank #2
Is pet ownership declining?
No. Pet ownership in the U.S. continues to grow. In 2025, about 94 million households have at least one pet, compared to 2023, when the number was 82 million.
Has pet ownership increased?
Yes. More Americans are bringing pets into their homes every year, especially younger generations like Millennials and Gen Z.
How common is it to own a pet?
Pet ownership is very common in the U.S. Most Americans see their pets as part of the family, and about half say their pets are just as much a family member as any person28.
What gender is more likely to own a pet?
Women are more likely to own pets. Studies show that between 54-60% of pet owners are women, according to multiple sources, including Infogroup (60%, 2020 study of 50,000 pet owners)29, AncestryDNA Traits Learning Hub (54.3%)30, and Pew Research Center (2023 survey of 5,073 U.S. adults)31.
What do pet owners spend the most money on?
Veterinary care is one of the biggest costs, and it’s typically one-third of pet-related spending.
Are pet owners really happier?
Yes. Many pet owners say their pets boost their well-being. About 86% reported that their pets have a positive impact on their mental health, according to a poll by the American Psychiatric Association32. Most credit their pets with reducing stress and anxiety, offering companionship, and providing unconditional support.
What percent of Gen Z have pets?
In 2024, Gen Z made up 20% of pet-owning households
What states have the most pet owners?
Vermont has the highest percentage of cat ownership in the U.S., according to the AVMA, with about 45% of households owning at least one cat. Other states with high cat ownership include Maine, Oklahoma, and Indiana.
Sources
- https://americanpetproducts.org/news/the-american-pet-products-association-appa-releases-2025-state-of-the-industry-report
- https://americanpetproducts.org/industry-trends-and-stats
- https://americanpetproducts.org/news/the-american-pet-products-association-appa-releases-2025-state-of-the-industry-report
- https://naphia.org/industry-data/section-2-total-pets-insured/
- https://ebusiness.avma.org/files/ProductDownloads/eco-pet-demographic-report-22-low-res.pdf
- https://www.dogster.com/statistics/pet-ownership-statistics
- https://www.animalsandsociety.org/wp-content/uploads/2016/04/staats.pdf
- https://www.avma.org/news/pet-population-continues-increase-while-pet-spending-declines
- https://www.cnbc.com/2018/02/09/the-worlds-wealthiest-tend-to-be-dog-people-not-cat-people.html
- https://www.humaneworld.org/sites/default/files/docs/HSUS_More-Than-a-Pet-Harris-Poll-2024.pdf
- https://www.consumeraffairs.com/finance/raising-a-child-vs-owning-a-dog.html
- https://americanpetproducts.org/industry-trends-and-stats
- https://www.petfoodindustry.com/pet-ownership-statistics/article/15712905/us-pet-population-growth-slow-cats-rise-dogs-fall
- https://www.akc.org/most-popular-breeds/
- https://www.petfoodindustry.com/pet-ownership-statistics/article/15712905/us-pet-population-growth-slow-cats-rise-dogs-fall
- https://cfa.org/cat-talk/most-popular-breeds-for-2024/
- https://wallethub.com/edu/most-pet-friendly-cities/5562
- https://www.nar.realtor/blogs/economists-outlook/a-stunning-stat-there-are-more-american-households-with-pets-than-children
- https://www.nar.realtor/blogs/economists-outlook/a-stunning-stat-there-are-more-american-households-with-pets-than-children
- https://globalpetindustry.com/article/pets-becoming-more-human-ever/
- https://www.animalsandsociety.org/wp-content/uploads/2016/04/staats.pdf
- https://www.avma.org/news/pet-population-continues-increase-while-pet-spending-declines
- https://www.petfoodindustry.com/pet-food-market/market-trends-and-reports/news/15747258/report-us-pet-food-inflation-slows-but-veterinary-costs-keep-rising
- https://www.consumeraffairs.com/finance/raising-a-child-vs-owning-a-dog.html
- https://www.consumeraffairs.com/pets/how-much-does-a-vet-visit-cost.html
- https://www.petfoodindustry.com/pet-food-market/article/15463555/pet-owner-demographics-get-grayer-more-golden
- https://worldpopulationreview.com/country-rankings/dog-ownership-by-country
- https://www.pewresearch.org/short-reads/2023/07/07/about-half-us-of-pet-owners-say-their-pets-are-as-much-a-part-of-their-family-as-a-human-member/
- https://www.prnewswire.com/news-releases/data-pet-owners-far-more-likely-to-be-female-affluent-older-301035570.html
- https://www.ancestry.com/c/traits-learning-hub/pet-ownership
- https://www.pewresearch.org/short-reads/2023/07/07/about-half-us-of-pet-owners-say-their-pets-are-as-much-a-part-of-their-family-as-a-human-member/
- https://www.psychiatry.org/news-room/news-releases/positive-mental-health-impact-of-pets
Director of Marketing & Foster/Rescue Parent - Pawlicy Advisor
Edwin Plotts rescues and rehomes cats in Savannah, GA - while leading Pawlicy Advisor's brand growth. He's a pet parent of two rescued sibling cats: Greyson and Babs. He's also an avid volunteer with Flatbush Cats and The Toby Project.
Do you want to find the best pet insurance?
Let's analyze your pet's breed, age, and location to find the right coverage and the best savings. Ready?
Analyze My PetAbout Pawlicy Advisor
Recommended by the American Animal Hospital Association and veterinarians nationwide, Pawlicy Advisor makes buying the best pet insurance easier. We compare top brands and match you to the right protection at a great price. Our free service has helped over 1 million happy pet owners.
More on Pet Fun


More on Veterinary Costs


Guides
When Pet Insurance Is Worth It